

Why Software Projects Fail: What 195 Conversations with Software Leaders Actually Revealed
A summary of the Sonatafy Software Delivery Failure Index, 2026 Edition

Most research on software failure is either too abstract to act on or too narrow to trust. Industry surveys ask leaders what they think went wrong. What leaders say in a survey and what they say on a recorded podcast, under no obligation to protect their reputation, are different things.
That difference is what the Sonatafy Software Delivery Failure Index is built on.
For the past year, I have been recording Software Leaders Uncensored: unfiltered conversations with CTOs, VPs of Engineering, CIOs, and founders at software organizations from growth-stage through enterprise. The format is built for honesty rather than promotion. Leaders are asked what actually broke, what they would do differently, and what the cost of the lesson was.
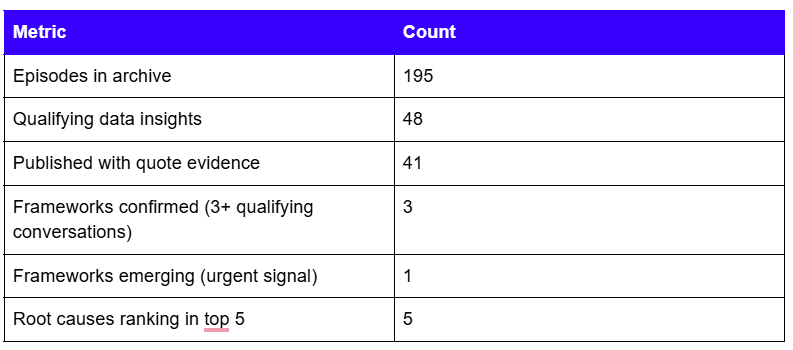
The 2026 edition draws from 195 episodes recorded between April 2025 and April 2026. Of those, 48 met the selection criteria for inclusion as qualifying failure narratives: the practitioner named a specific failure, its root cause, and its consequence in enough detail to extract structured insights. Vague difficulty did not count. 41 of the 48 produced publication-grade quote evidence. The remaining 7 informed pattern recognition without clearing the quote bar.
This is not a survey of opinion. It is a structured extraction of failure narratives where a practitioner named the cause, the consequence, and the change.
What surprised me most
I went into this research expecting to find that most software failures were technical. Bad architecture decisions, accumulated technical debt, wrong frameworks chosen at the wrong moment in a company’s growth.
That is not what the data showed.
The three most frequent root cause patterns each appeared in nine qualifying conversations, and none of them were primarily technical. They were structural. Building before validating. Process breakdown under deadline pressure. People scaling without context or accountability.
The finding that stuck with me most: teams that hired the fastest were often the ones struggling hardest with delivery. Adding engineers was not solving the problem. In many cases, the data showed it was making it measurably worse.
That was not what I expected. It is what the leaders told me.
What I got wrong going in
I expected the AI section to be the dominant finding.
It is not. At least not yet.
The AI Validation Gap is real, the incidents-per-customer data is alarming, and the severity per instance puts it at framework status despite a smaller qualifying sample. But the three structural failure patterns have more evidentiary weight in this dataset, and they are also more actionable right now for most organizations.
I also expected recovery to look like a change in talent or tooling. It did not. Across the qualifying conversations, the leaders who turned delivery around almost always made a structural change before a personnel or technology change. They installed ownership. They enforced process discipline. They reframed what delivery meant.
That shift in my own framing shaped how the report is organized.
The dataset at a glance
Recording window: April 18, 2025, to April 24, 2026.
Industries represented: SaaS and vertical software, fintech and insurtech, healthcare technology, real estate and automotive technology, IT services and AI infrastructure, workplace and DevOps tooling.
The primary finding
Teams that added engineers without fixing their delivery model got slower, not faster.
This finding appeared across the dataset with sufficient consistency to anchor the entire report. New hires needed months to ramp. Information dissemination broke down. The collaboration advantages of smaller teams disappeared as organizations scaled from 10 to 100 engineers. The organization chart grew while delivery throughput plateaued or declined.
Adding headcount to a structurally broken delivery model does not yield a better one. It produces a bigger broken one.
Framework distribution across the dataset
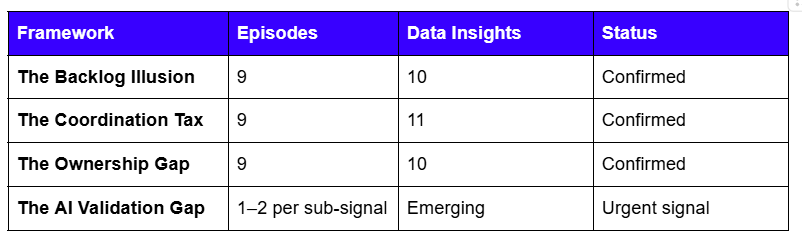
The three confirmed frameworks each surfaced across nine independent conversations, producing a combined 31 data insights. The AI Validation Gap earns inclusion not through frequency but through severity per instance, and through the consistency of the signal pattern across multiple sub-types.
The Backlog Illusion
The false signal when backlogs show activity without progress. Tickets close, sprints complete, velocity looks healthy, but the team is not delivering business outcomes.
It appeared in nine qualifying conversations across ten data insights, making it the top-ranked root cause by cumulative severity in the dataset.
The Backlog Illusion manifests when teams build features no one uses, when roadmaps are driven by competitor imitation rather than validated user need, and when engineering is measured by output volume rather than business impact.
The $42M case. Armando Viteri, President and CEO of Neubloc, described in Episode 81 what he called the catastrophic failure of his career: scaling into 20 geographies under the assumption that the model working in the first market would generalize. The assumption was never validated against local market conditions, regulatory differences, or distribution dynamics before the engineering and operational footprint was committed. Capital was available. Market validation was not. As Armando framed it: capital availability is not market validation. The ability to raise money and the ability to build something people need are entirely separate questions.
The 12-month case. Nathan Miller, Founder, President, and CEO of Rentec Direct, described in Episode 165 a different expression of the same pattern. Rentec hired a senior software developer and committed a full year to building an integration with a partner company. The partner had sold them on the platform’s potential. After a year, the integration was launched. No one used it. The partner had not delivered on its claims and was not as popular as it had represented. The cost was a full year of a senior developer’s salary plus the opportunity cost of everything else that developer could have built.
Justin Farris, VP of Product at Read AI, described the emotional cost of this pattern in Episode 151: months of work and energy, products shipped that did not gain adoption, and the organizational toll of resetting the roadmap and starting over.
The recovery move practitioners described consistently: reframe the unit of delivery from “feature shipped” to “outcome validated.” Smaller experiments before commitments. Explicit kill criteria for in-flight work. Product leadership is empowered to stop engineering before the sunk cost grows.
The Coordination Tax
The hidden overhead is created when teams skip alignment. Every rework cycle, handoff, and clarification meeting taxes delivery velocity, and the tax compounds.
It appeared in nine qualifying conversations across eleven data insights. The pattern surfaced most heavily in distributed teams, scaling teams, and teams without effective product-engineering alignment.
Under timeline pressure, the practices that protect delivery quality were the first thing teams sacrificed. Requirements were written after development started. Testing windows were compressed to hit fixed deployment dates. Agile ceremonies persisted in name but lost their substance. The damage rarely surfaced during the sprint, when corners were cut. It surfaced two or three sprints later, as rework.
William Steenbergen, Co-founder and CTO of Federato, described it in Episode 167 as a cascading effect: rushing testing, rushing decisions, and making more mistakes as a result of shortcuts that, individually, seemed minor.
The downstream cost of skipped alignment was consistently reported as larger than the time it would have taken to do the work correctly the first time, but it was paid in a different week, by a different team, in a different ticket. That displacement makes it invisible until the cumulative damage is already significant.
The recovery move was structural, not motivational. Teams that recovered installed a hard contract on the entry of work into the sprint: written specs, definition of ready, signoffs upstream. They protected that contract from the pressure of the timeline. Process discipline was treated as a forcing function, not overhead.
The Ownership Gap
The structural gap between having engineers and having delivery accountability.
Nine qualifying conversations, ten data insights. The clearest predictor of healthy delivery in the dataset was a single named owner per product surface, with headcount added to that ownership structure rather than replacing it.
Jeff DePascale, CTO of CallRevu, described in Episode 36 the experience of believing alignment existed, confirming it verbally, going to sleep, and waking up the next day to discover nothing had actually been understood or acted on.
The headcount trap. An anonymized Director of Engineering at a genomics and health-tech company was promoted from senior engineer but continued operating as an individual contributor, staying deep in the technical weeds on projects that should have been delegated. Simultaneously, the team was hiring new engineers to scale delivery capacity.
The result: eight months of operating as a single point of failure, with the team unable to keep pace with commitments made by sales and leadership. New engineers needed nine to twelve months to reach full domain expertise. More headcount. Less throughput.
This is the Ownership Gap operating at two levels simultaneously. At the leadership level, the director retained execution responsibility instead of building the team’s capacity to own outcomes independently. At the team level, new engineers lacked the domain context needed to move fast.
Recovery looked the same across organizations: a deliberate move from team-of-engineers to team-with-owner. One person is made accountable for the sprint cadence, architectural decisions, and code quality of a defined product surface. Headcount additions came after the ownership structure, not before.
The AI Validation Gap
I want to be direct about what this framework is and is not.
Unlike the first three frameworks, the AI Validation Gap is still emerging in the dataset. The sample size per sub-signal sits at N=1 to N=2, below the report’s publication threshold for confirmed framework status. I am including it because the severity of the incidents and the consistency of the signal across independent sources suggest it deserves immediate attention, not because the frequency warrants the same evidentiary confidence as the first three.
That transparency is part of the research discipline. An emerging pattern observed at low frequency but high severity is not the same as a confirmed pattern. It is a warning signal worth watching closely.
With that context established, the signal is alarming.
Sylvain Kalache, Head of AI Labs at Rootly, stated in Episode 185 that incidents per customer have increased by a factor of three over the last three years. Companies are experiencing three times more outages and more incidents than in 2023. AI-accelerated development velocity is outpacing the tooling and processes teams use to detect and resolve failures.
The AI Validation Gap is clustered into four sub-signals.
The reliability paradox: shipping faster means more changes, more surface area, and more failures arriving at the worst possible moment.
The knowledge transfer problem: AI tools promise to accelerate delivery, but only for teams where knowledge is distributed. When context lives in one person’s head, AI amplifies nothing. The bottleneck is not compute. It is the single engineer who has not yet taught the system, or the team, what they know.
Stakeholder expectations outrunning reality: Matthew Peters, CTO of CAI, described in Episode 125 the persistent organizational pressure to explain why AI has not yet multiplied productivity by a factor of ten. The expectation is real. The delivery capacity is not. The gap between them compounds silently until a missed deadline makes it visible.
Hidden trust and governance debt: In Episode 180, Bradley Friemel, CTO of Fullsteam, described the specific compounding risk of technologists overselling what AI can accomplish in production environments. Overpromising builds governance debt. The gap between what stakeholders expect and what teams can deliver gets hidden by workarounds until delivery exposes it.
The twelve warning signs
Across the 48 qualifying data insights, project failure followed a recognizable lifecycle. Warning signs appeared months before the failure became visible to leadership.
The four stages: quiet drift (cost of correction measured in days), process erosion (weeks), compounding pressure (quarters), and the failure event (cost already paid).
The report includes a twelve-point scorecard. Score each warning sign 0 to 2 based on observed instances in the last 90 days, then sum across all twelve.
The twelve signs: no single named owner per outcome; roadmap reacting to competitor releases rather than user validation; specs written after development started; ramp-up consuming more than three months per hire; deadlines met by cutting testing; velocity declining as headcount grows; AI features shipping without an eval framework; incidents per customer increasing; partner-built features with no adoption signal; unresolved product-engineering-design tension; replatforms running without explicit kill criteria; stakeholder AI expectations exceeding delivery capacity.
Score bands:
0 to 5: structurally sound. Run the scorecard quarterly. 6 to 12: one framework is likely active. Targeted intervention this quarter. 13 to 18: two or more frameworks compounding. Structural change required, not motivational. 19 and above: multiple compounding patterns. Redesign the delivery model before adding capacity.
Run it independently with three or more leaders, then reconcile. A ten-point spread between the highest and lowest score is itself a signal: the leadership team lacks a shared diagnosis.
What high-performing teams do differently
Five structural differentiators appeared consistently across organizations that avoided or recovered from delivery failure. None of them is heroic. All of them are designable.
They treat ownership as architecture, not a hiring outcome. One person, not a committee, is accountable for the outcome of each product surface. The clearest predictor of healthy delivery in the dataset.
They protect the entry of work into the sprint. A hard contract on what enters: written specs, definition of ready, upstream sign-offs. The contract is enforced under timeline pressure, not relaxed.
They measure delivery in terms of outcomes, not outputs. Sprint reports lead with what shipped to production and what changed in the customer or business signal. Ticket velocity is a hygiene metric, not a leadership metric.
They run replatforms and AI features with eval frameworks staged in advance. Major engineering bets are run with explicit success criteria and kill points. AI features have evaluation frameworks before they launch dates.
They surface product-engineering-design tension at a named forum. Standing executive forum where the three disciplines are required to bring unresolved decisions before they become delivery commitments. Soft alignment fails under pressure. Structural alignment does not.
Five things to start. Five things to stop.
Start: score your team against the twelve warning signs with three independent leaders. Name a single accountable owner per outcome before adding headcount. Install a sprint-entry contract and enforce it under deadline pressure. Re-cut the sprint review around outcomes, not tickets. Stage AI evals before AI launch dates.
Stop: adding headcount to a broken delivery structure. Scaling before validating unit economics in the first market. Committing to multi-quarter integrations without kill criteria. Shipping integrations without partner adoption commitments. Accepting boardroom AI projections, you cannot measure against current tooling and team throughput.
If there is one lesson from 195 conversations
Software projects rarely fail because of technology.
They fail because organizations mistake activity for progress, coordination for ownership, and hiring for execution.
The warning signs appear months before the failure becomes visible to leadership. Most teams simply do not know where to look.
The full report
The Sonatafy Software Delivery Failure Index, 2026 Edition, is 25 pages. It includes the full root cause analysis with practitioner quotes, the AI failure mode sub-signal detail, three case studies with dollar-level cost analysis, the twelve-point scorecard, five recovery patterns with time-to-impact estimates, and the full framework-to-delivery-model mapping.
Download it at https://www.sonatafy.com/reports/why-software-projects-fail
If your score is above 12 or if you are already in a late-stage delivery failure, the 60-minute Software Delivery Failure Diagnostic provides a structural read of your delivery model. Book at sonatafy.com/diagnostic-readout.
Steve Taplin is CEO of Sonatafy Technology and host of the Software Leaders Uncensored podcast. He is the author of Fail Hard Win Big and co-author of The Backlog Illusion with Sonatafy CTO Chris Horvat. The Software Delivery Failure Index, 2026 Edition, draws from 195 episodes recorded from April 2025 to April 2026.
Learn more at www.sonatafy.com
Listen at www.softwareleadersuncensored.com.
Contact: info@sonatafy.com
Great article. Very informative.